1. Global Energy Overview
Over the past two decades, renewable electricity generation has more than doubled. Yet fossil fuels still provide nearly 60% of output. This is a uneven progress. It reveals that innovation and inertia policy ambition often moves faster than infrastructure capacity.
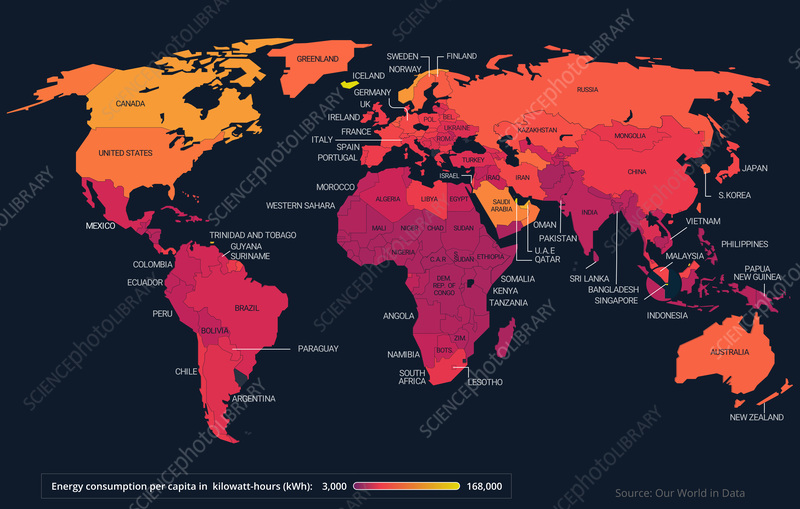
2. Regional Energy Mix
Europe’s reliance on renewables continues to rise through offshore wind expansion. However, Asia faces dual pressures of industrial demand and decarbonization. This regional asymmetry reveals how transitions are shaped by energy security and market structure.
| Region | Renewables (%) | Fossil Fuels (%) |
|---|---|---|
| Europe | 47 | 53 |
| North America | 33 | 67 |
| Asia | 29 | 71 |
3. Innovation & Investment
Renewable investment reached 1.7 trillion USD in 2023. The fastest growth came from storage and AI-integrated grids, which is not merely generating energy, but also distributing it intelligently. As power systems decentralize, the challenge was about production years ago, but now its more about prediction.
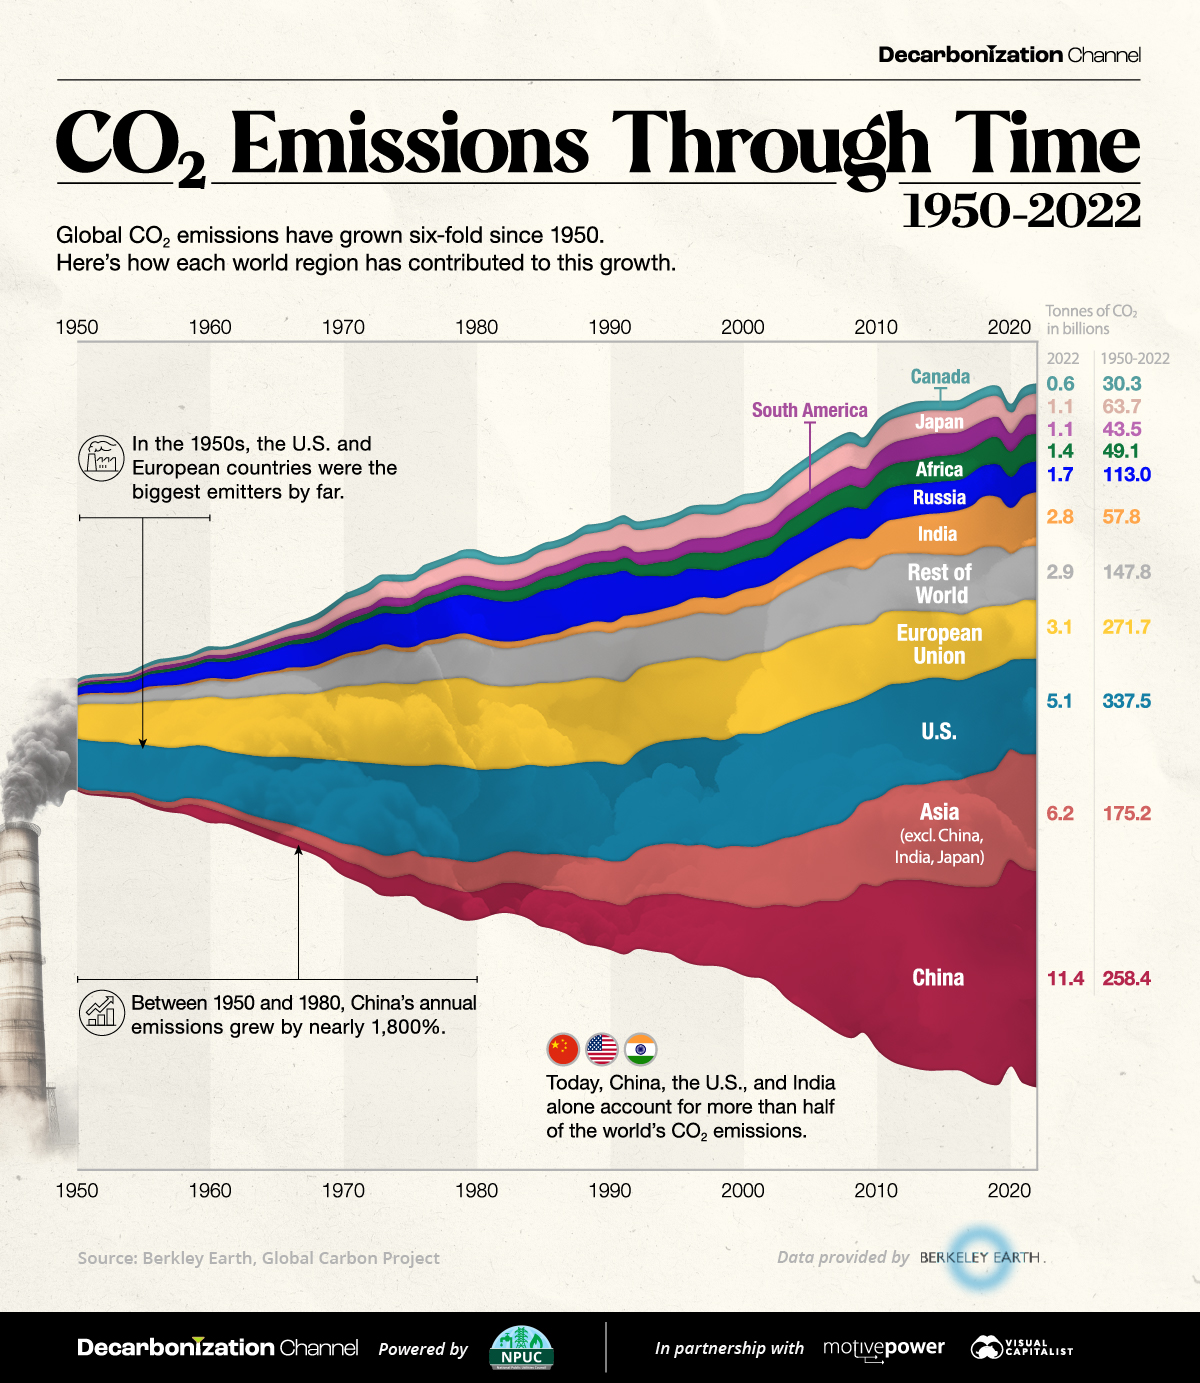
4. Tracking Emission Reductions
By comparing the emissions year by year, analysts can identify rebound effects and policy loopholes. The significant increase in emissions after 2020 reveals the fragility of global emission reduction progress.
5. Toward a Sustainable Future
Achieving net-zero isn’t just a technological task but also a social infrastructure. Investment equity, education, and public participation define whether renewable energy becomes a shared benefit or another divide. Sustainability will be achieved finally when data bring out more public empathy towards the environment.