Mental Health Care Utilization (U.S. National Health Interview Survey, 2023)
This lab explores recent mental health care utilization patterns using CDC’s National Health Interview Survey dataset.
The charts below analyze how demographic factors (such as gender, age, and race) affect the likelihood of taking prescription
medication or receiving counseling for mental health in the last four weeks.
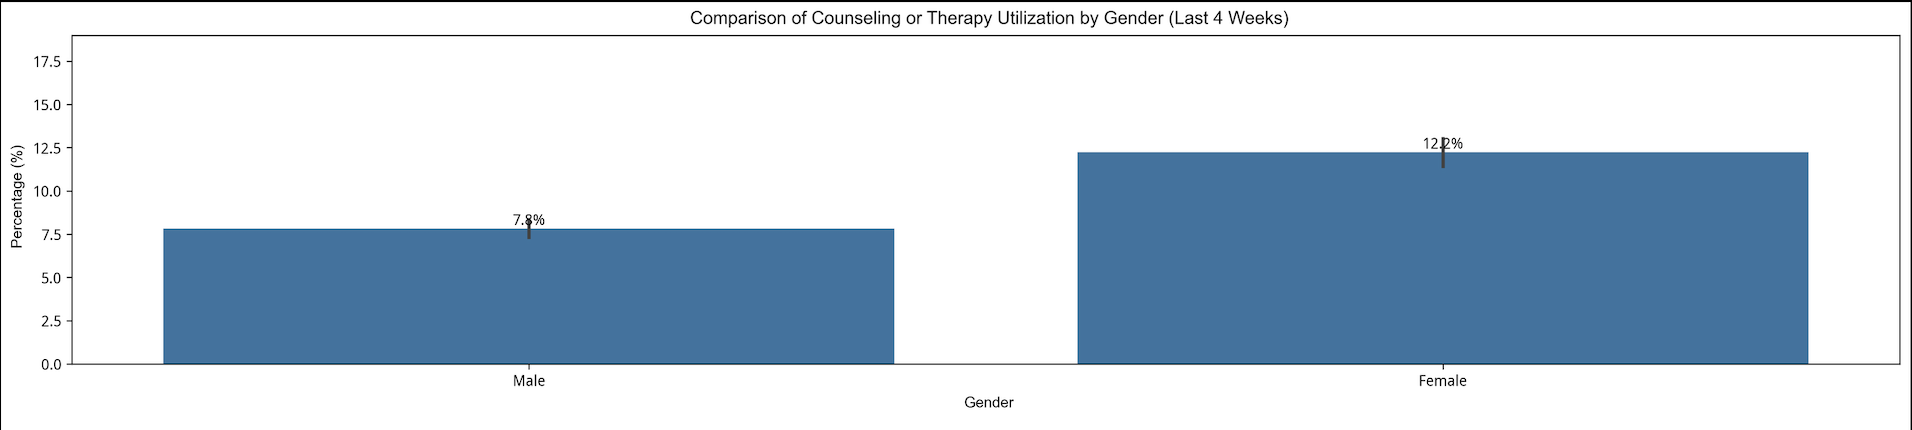
1. Counseling or Therapy Utilization by Gender
Female respondents (12.1%) were almost twice as likely as male respondents (7.8%)
to have received counseling or therapy in the last four weeks. This difference highlights social and cultural
disparities in mental health help-seeking behavior.
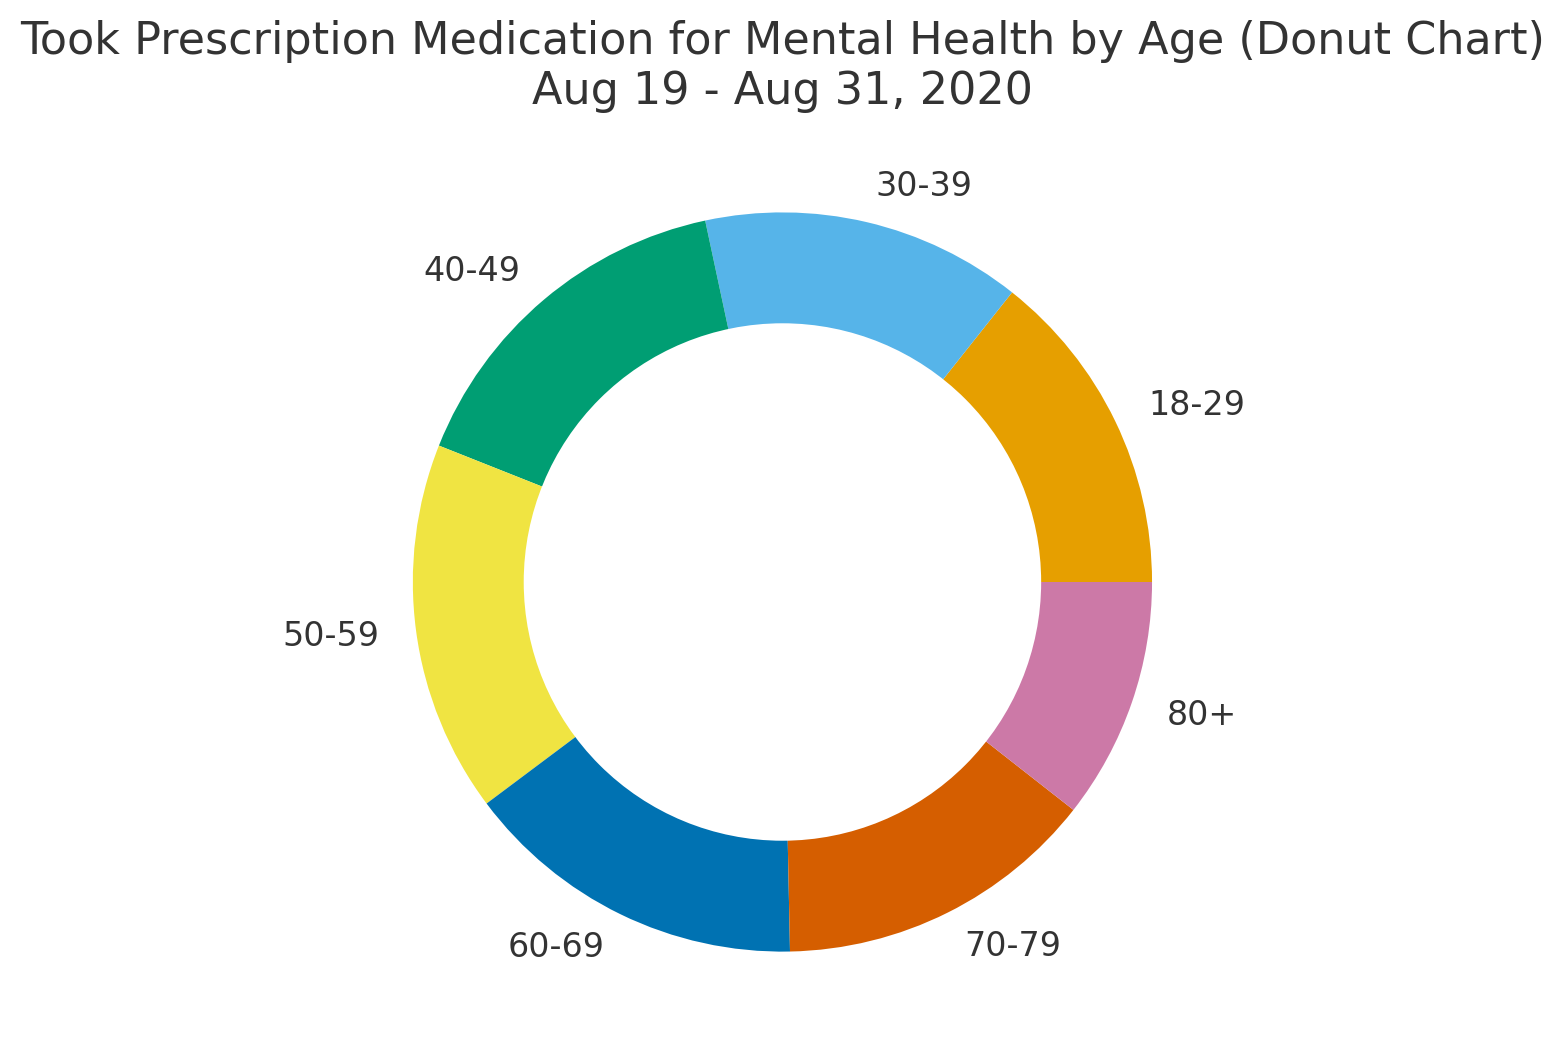
2. Prescription Medication Usage by Age Group
Middle-aged adults (40–59 years) show the highest prescription medication use (21–22%), while younger adults
(18–29 years) and older adults (70+) exhibit lower rates. The donut chart visually emphasizes how medication reliance
peaks during working age, suggesting stress and healthcare access as contributing factors.
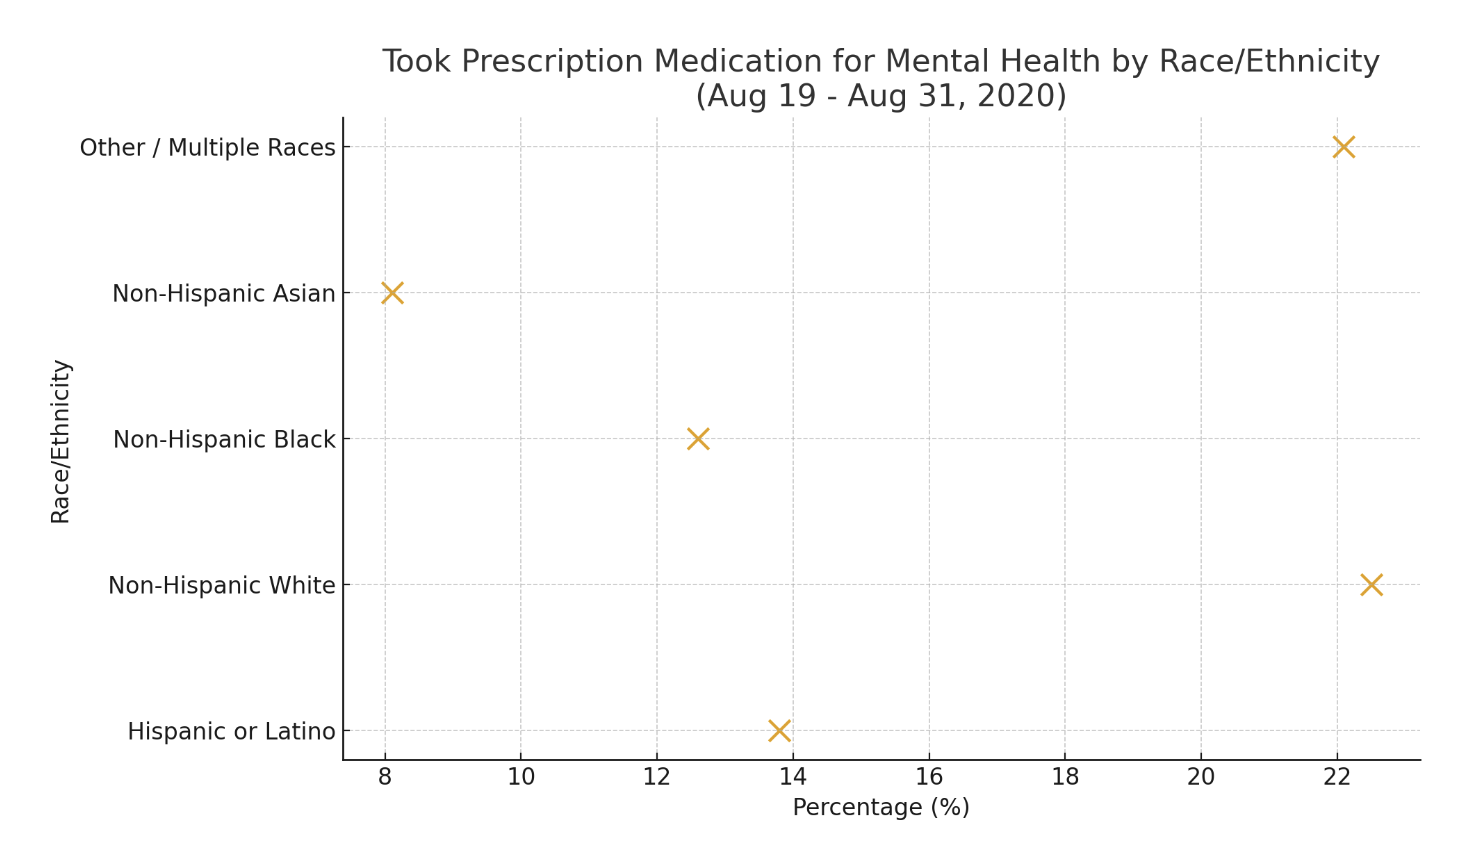
3. Prescription Medication Usage by Race/Ethnicity
Non-Hispanic White and Multiracial respondents reported the highest medication use (22–23%), while Asian and Hispanic
respondents reported much lower rates (8–14%). The scatter plot reveals persistent racial and cultural gaps in treatment
access and perceptions of mental health medication.
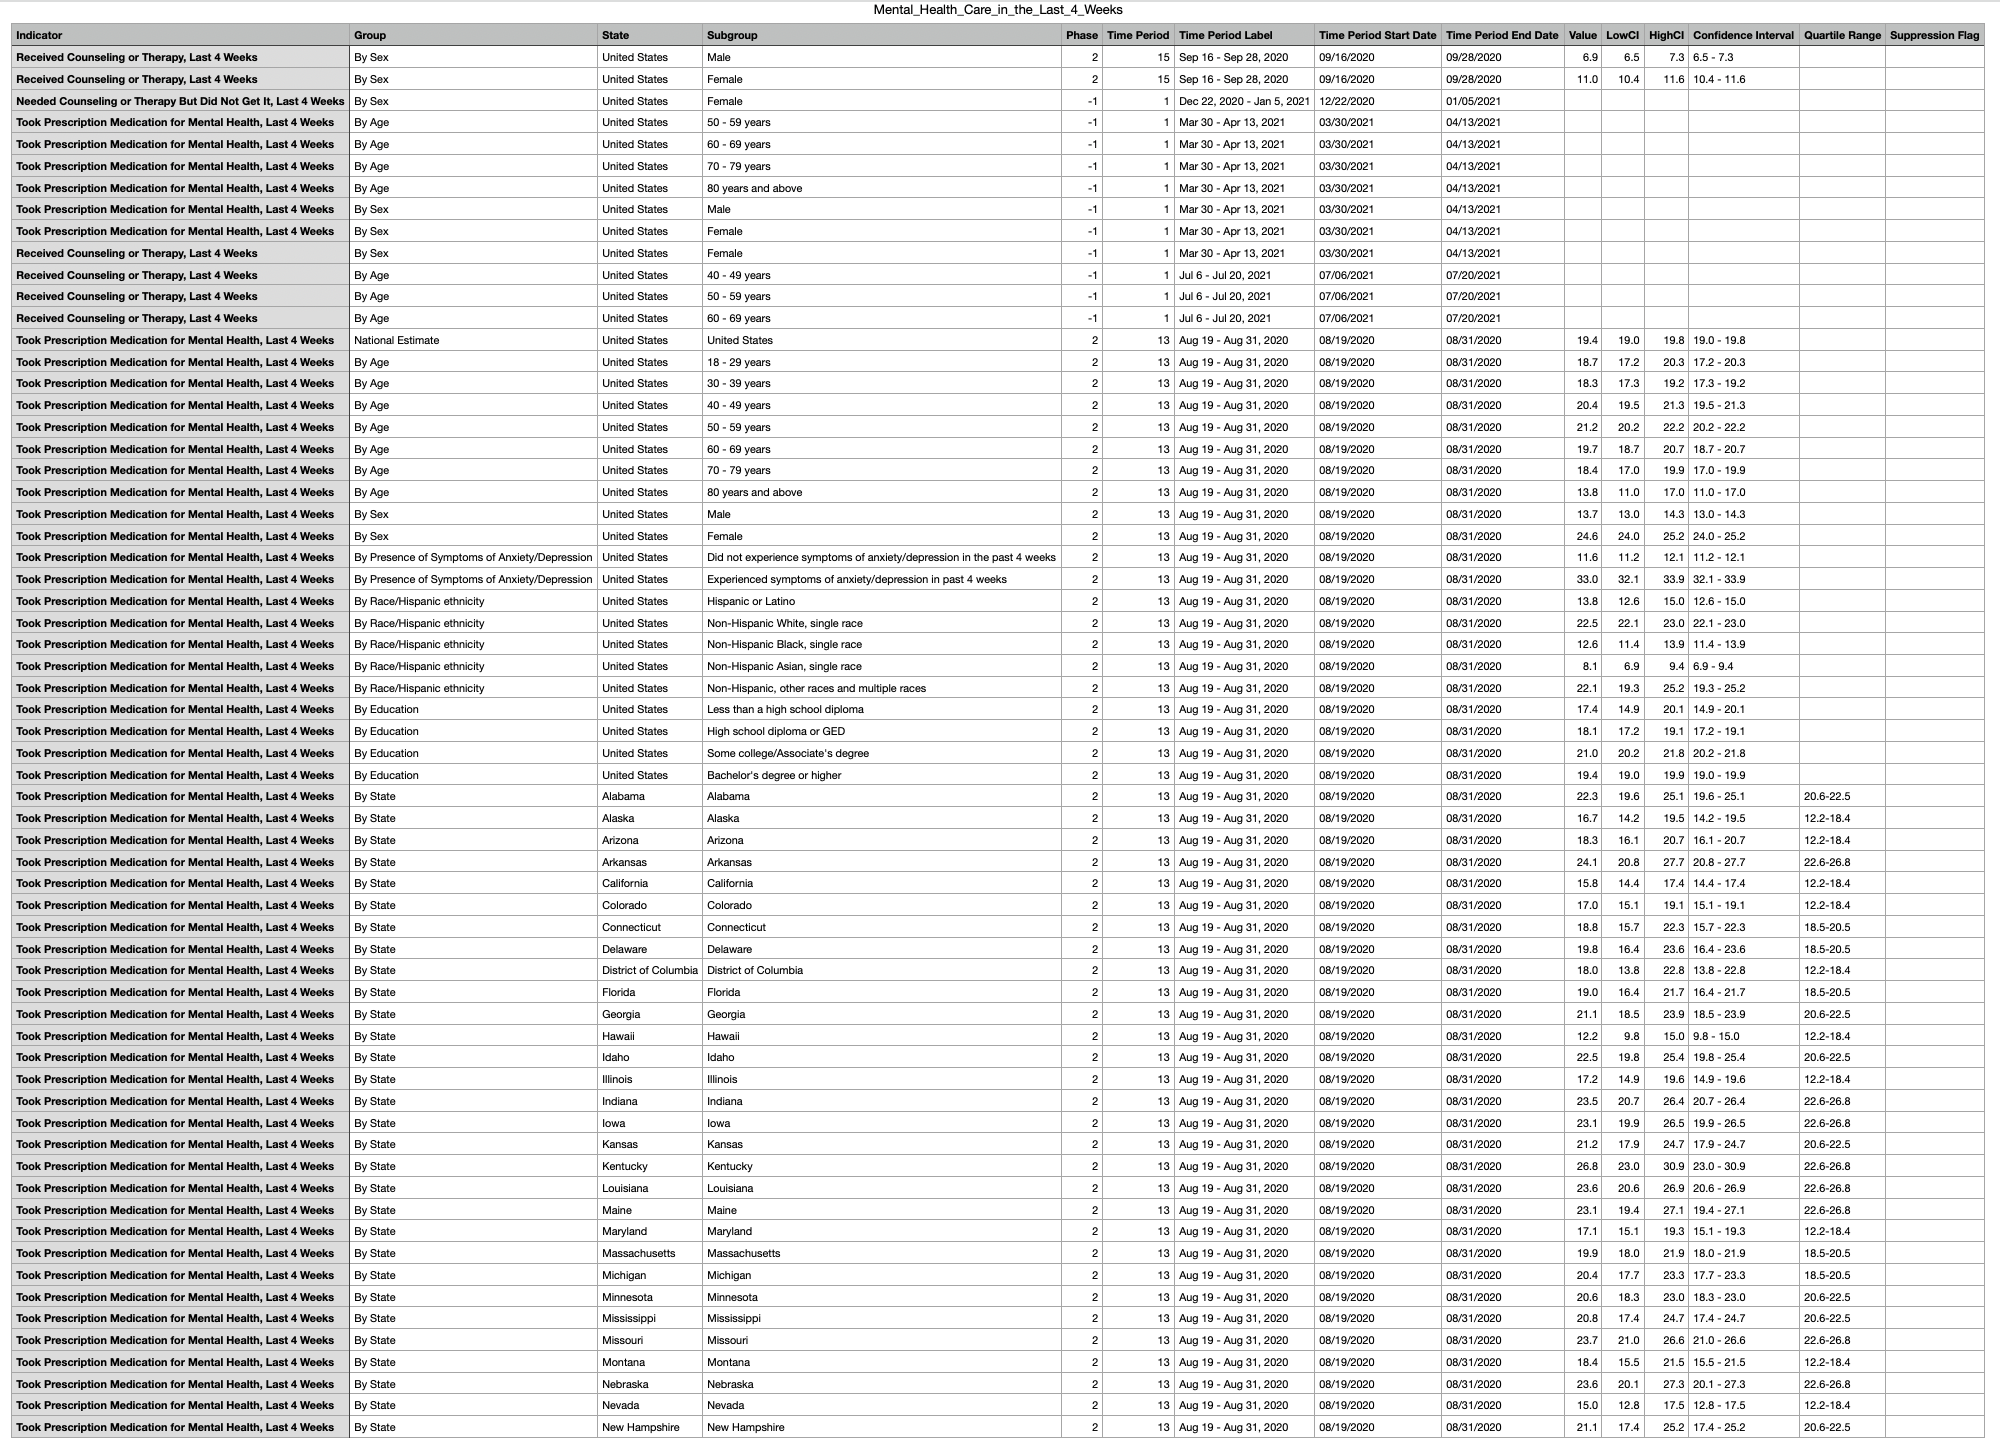
Original Dataset (Excerpt)
The dataset provides national estimates of mental health service utilization across demographic groups and states.
Key variables include indicator (type of service), group (sex, age, race, education),
value (percentage using service), and confidence intervals.
Data were collected during 2020–2023 under the U.S. CDC’s National Health Interview Survey.